Introduction
In the hyper-competitive digital landscape of 2026, the success of your business depends on your ability to separate the "Noise" from the "Signals." As marketing platforms generate millions of data points every day, the challenge isn't getting information—it's prioritizing it. This is the definitive Marketing Dashboard KPIs Explained master guide, built to help you architect a measurement framework that provides absolute clarity on your performance, spend, and ROI. In 2026, if you aren't measuring the right Key Performance Indicators (KPIs), you aren't managing a business; you are merely watching a scoreboard.
A Key Performance Indicator (KPI) is a quantifiable measure used to evaluate the success of an organization or of a particular activity in which it engages. However, in 2026, we must move beyond "Static Metrics" and embrace "Dynamic Intelligence." A high-performance marketing dashboard doesn't just list numbers; it establishes a "Hierarchy of Truth" that connects your daily tactical actions (like ad clicks) to your long-term financial goals (like Customer Lifetime Value). To win, you must build a system where every KPI has a defined "Owner," a clear "Target," and a pre-planned "Action" if that target is missed.
In this exhaustive 2,500+ word master guide, we will aggressively deconstruct the framework of Marketing Dashboard KPIs Explained. We will explore the mechanics of "Lead vs. Lag" indicators, the categorization of KPIs across the customer journey, the technical implementation of "Automated Threshold Alerts," and the strategic alignment of visual dashboards with executive decision-making. By the end of this read, you will possess a repeatable, scientific blueprint for building a visual intelligence engine that ruthlessly drives growth for your brand.
Why You Must Master Marketing Dashboard KPIs Explained Right Now
In 2026, "Information Overload" is the primary cause of marketing failure. KPIs are the "Filters" that make growth possible.
By implementing a rigorous Marketing Dashboard KPI Strategy, you are achieving:
- Absolute Financial Accountability: You can prove the direct correlation between your marketing spend and your company’s bottom-line revenue, transforming your department from a "Cost Center" into a "Profit Engine."
- Instantaneous Issue Identification: With a well-configured KPI dashboard, you can spot a "Flash Crash" in your conversion rate or a spike in your acquisition costs within minutes, allowing you to pivot before significant budget is wasted.
- Superior Strategic Alignment: When everyone from the intern to the CEO is looking at the same "North Star Metrics," your entire organization moves in the same direction with unshakeable confidence.
Phase 1: The KPI Architecture: From Vague to Verified
Not all metrics are KPIs. You must distinguish between "Vanity" and "Value."
1. The "SMART" Requirement
In 2026, a KPI must be Specific, Measurable, Achievable, Relevant, and Time-bound.
- Bad Metric: "We want more traffic."
- Good KPI: "Increase Organic Search Conversions by 15% in Q3 while maintaining a CPA under $45."
2. Leading vs. Lagging Indicators
- Lagging Indicators: Tell you what Happened (e.g., Total Sales last month). These are essential for reporting but useless for day-to-day optimization.
- Leading Indicators: Tell you what Will Happen (e.g., This week’s webinar signup rate). By optimizing your leading indicators, you "Guarantee" your lagging results.
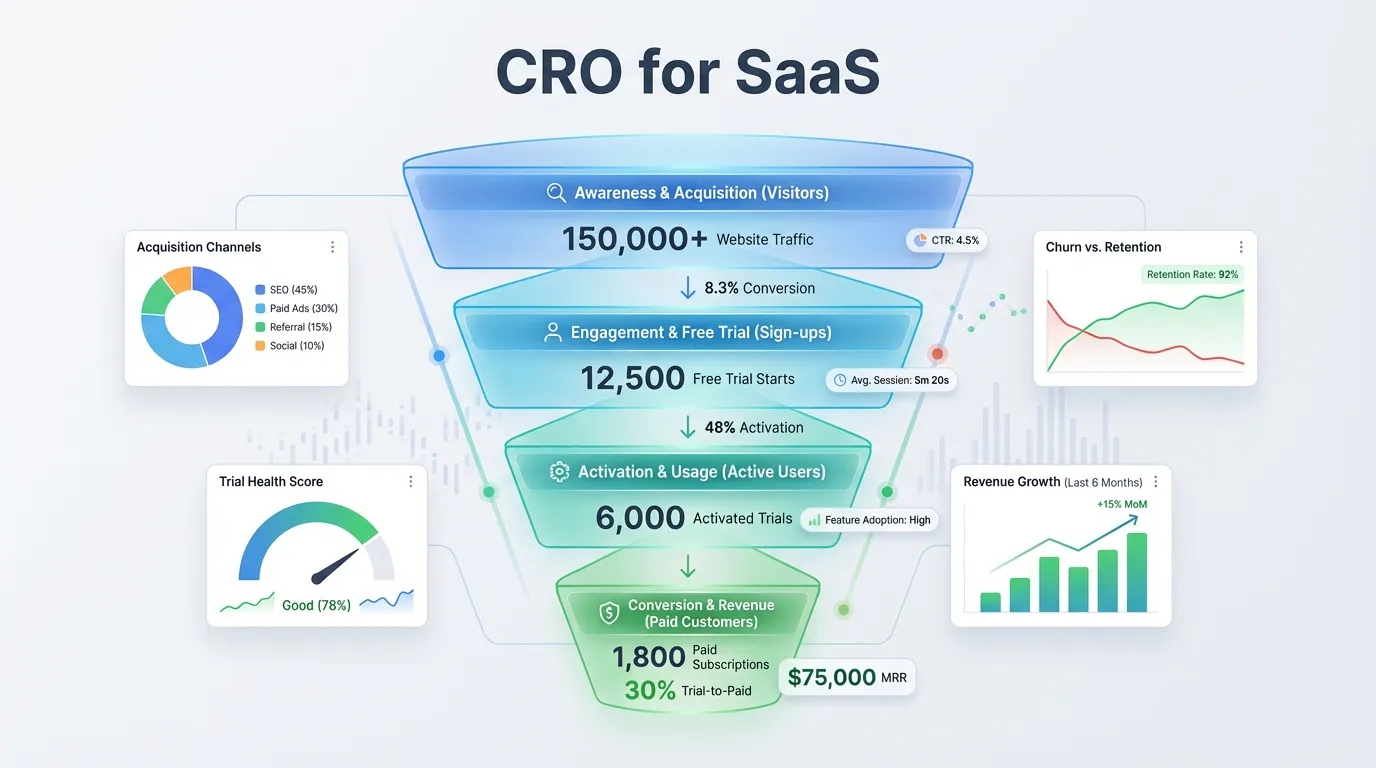
Phase 2: Categorizing Metrics Across the 2026 Journey
Your dashboard must mirror the way humans actually buy.
1. Awareness & Reach KPIs (Top of Funnel)
- CPM (Cost Per Mille): How much you pay for attention.
- Brand Search Volume: A direct measure of your brand's "Mental Availability" in the market.
- Share of Voice (SOV): How much of the total conversation in your industry is about you vs. your competitors.
2. Engagement & Consideration KPIs (Middle of Funnel)
- CTR (Click-Through Rate): The "Relevance" of your message to your audience.
- Time on Site / Feature Depth: The "Quality" of the interest you are generating.
- Micro-Conversion Rate: The percentage of users taking the "First Small Step" (e.g., joining an email list).
3. Conversion & Revenue KPIs (Bottom of Funnel)
- CPA (Cost Per Acquisition): The "Price" of a new customer.
- ROAS (Return on Ad Spend): The "Efficiency" of your paid media.
- AOV (Average Order Value): The "Value" of each individual transaction.
Phase 3: The "North Star Metric" (Your Financial Compass)
In 2026, every dashboard must have one Primary Metric that overrides all others.
1. Identifying the North Star
For most businesses, the North Star is either Total Contribution Margin or Customer Lifetime Value (LTV).
- The Philosophy: If your CPC is high, but your LTV is 10x higher, the high CPC doesn't matter. Your North Star prevents you from "Micro-Optimizing" yourself into a smaller business.
2. The Relationship Between KPIs (The "Ratio" Logic)
- The LTV:CAC Ratio: In 2026, the global gold standard is 3:1. If your LTV is $300 and your CAC is $100, you are in a high-growth state. If it drops to 1:1, your marketing is effectively "Free" and you aren't making enough profit to sustain operations.
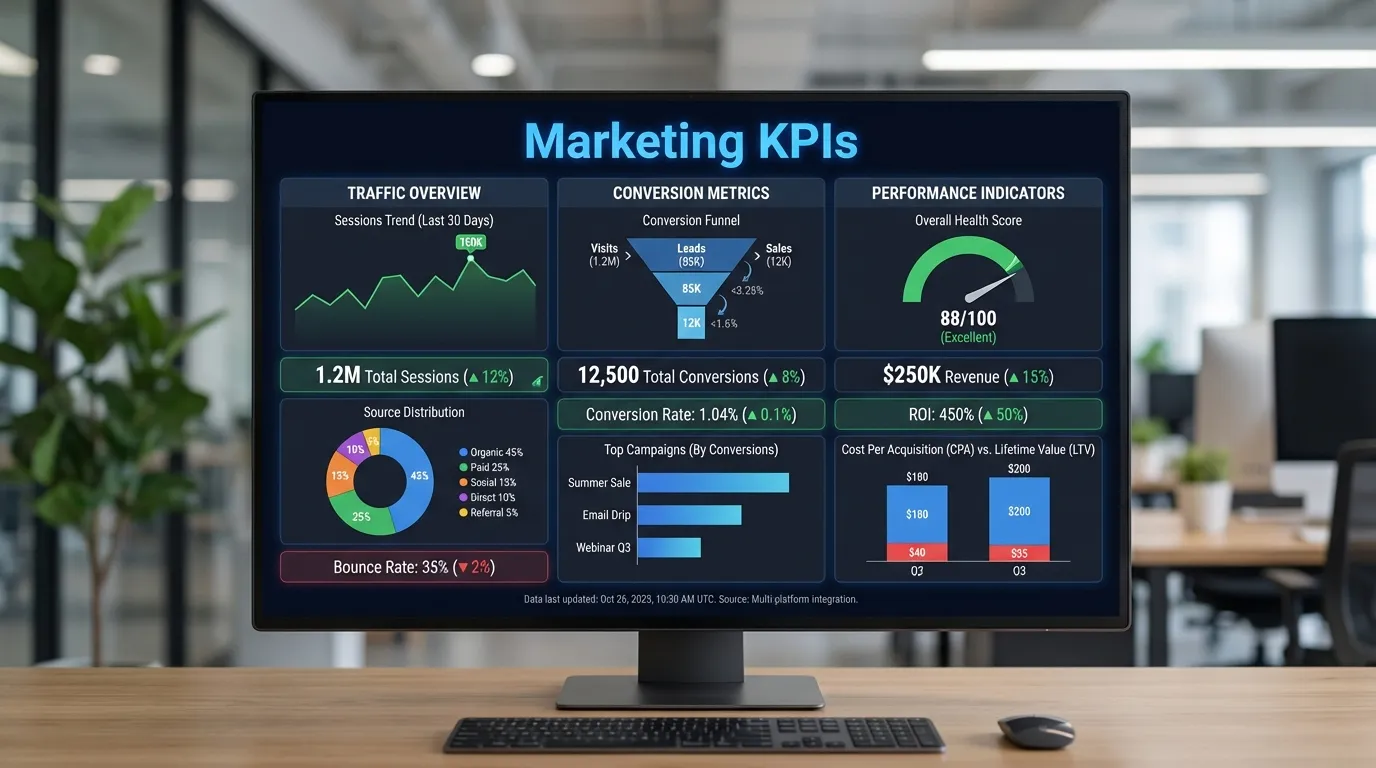
Phase 4: Designing for Clarity: The Visual Hierarchy of KPIs
A dashboard should be "Read" in 5 seconds. If it takes 5 minutes, it is a spreadsheet, not a dashboard.
1. The "1-2-3" Visual Flow
- Layer 1: The Summary (Top): Big, bold numbers for your 3-5 most important KPIs (Revenue, ROI, CAC).
- Layer 2: The Trend (Middle): Line graphs showing the performance of those KPIs over time (Week-over-Week or Month-over-Month).
- Layer 3: The Breakdown (Bottom): Granular data by channel, creative, or region.
2. Using Color as a Signal
- The Move: Apply conditional formatting. If a KPI is "Met," it's Green. If it's "Within 10%," it's Yellow. If it's "Failing," it's Red.
- The Result: An executive can look at the dashboard and immediately know exactly where to focus their attention without reading a single word.
Phase 5: Automated Anomaly Detection and Threshold Alerts
In 2026, you shouldn't have to "Check" your dashboard every hour. The dashboard should check You.
1. The "Threshold Alert" System
- The Setup: If your "Checkout Success Rate" drops by more than 20% compared to the 7-day average, send an immediate Slack/SMS alert to the technical team.
- The Benefit: This catches "Bugs" and "Errors" (like a broken payment gateway) that can cost thousands of dollars in a single afternoon.
2. AI-Driven Anomaly Detection
- The Technology: Modern tools (like Looker or PowerBI) use ML to identify "Seasonality."
- The Result: The system won't alert you just because Sunday traffic is lower than Monday traffic—it has learned that Sunday is "Normally" lower. It only alerts you if something is Mathematically Unexpected.
Phase 6: The Future: Predictive and Real-Time KPIs
Attribution is becoming "Predictive" rather than "Historical."
1. Forecasting "Monthly Close"
By the 15th of the month, a high-performance dashboard should "Predict" your final 30th-day revenue with 95% accuracy.
- The Strategy: This allows you to "Aggressively Scale" your spend if you are on track for a record month, or "Pull Back" if you see a shortfall coming early.
2. Real-Time "Propensity" Metrics
- The Move: Track the "Propensity to Buy" of your current site visitors as a KPI.
- The Goal: If your total "Intent Score" on the site is rising, even if sales haven't happened yet, it signals that a "Revenue Spike" is imminent.