Introduction
Modern software systems are becoming increasingly complex. Applications today run across distributed environments, cloud platforms, containers, and microservices architectures. While this complexity enables scalability and flexibility, it also creates new challenges for DevOps teams trying to maintain system reliability.
Imagine deploying a new feature through a CI/CD pipeline, only to find that your application slows down or crashes after deployment. Without proper visibility into your systems, identifying the root cause of the problem can be extremely difficult.
This is where observability DevOps tools become essential.
Observability allows teams to understand what is happening inside their systems by analyzing metrics, logs, and traces. Instead of guessing what went wrong, DevOps engineers can quickly identify issues, troubleshoot problems, and maintain system stability.
In this guide on the role of observability in DevOps, you will learn how observability works, why it is critical for modern DevOps practices, and which tools help organizations monitor and improve system performance.
By the end of this article, you will understand how observability helps DevOps teams build reliable, scalable, and high-performing systems.
Understanding Observability in DevOps
What is Observability?
Observability refers to the ability to understand the internal state of a system by analyzing its outputs.
In DevOps environments, these outputs usually include:
- Metrics
- Logs
- Distributed traces
By analyzing this data, engineers can determine why a system behaves the way it does.
Observability helps answer important questions such as:
- Why is the application slow?
- Which service caused the failure?
- What changed after deployment?
Without observability, troubleshooting complex systems becomes extremely difficult.
Observability vs Monitoring
Although often used interchangeably, observability and monitoring are different concepts.
Monitoring
Monitoring tracks predefined metrics and alerts teams when thresholds are exceeded.
Example:
- CPU usage above 90 percent
- Server downtime
- Memory spikes
Monitoring helps detect problems.
Observability
Observability goes deeper.
It allows engineers to explore system data and investigate unexpected issues without predefined alerts.
In simple terms:
Monitoring tells you when something is wrong.
Observability helps you understand why it is wrong.
Why Observability is Critical in DevOps
Modern DevOps practices rely on automation, continuous integration, and continuous deployment. As systems become more dynamic, observability becomes essential.
Faster Incident Detection
Observability tools provide real-time insights into system behavior.
This helps teams detect failures quickly before users experience problems.
Faster Root Cause Analysis
Instead of searching through multiple logs and servers manually, observability tools correlate system data automatically.
This speeds up troubleshooting.
Improved System Reliability
With better insights into application performance, teams can fix issues before they become major outages.
Better Collaboration Between Teams
Observability data is accessible to developers, operations teams, and site reliability engineers.
This improves collaboration across teams.
Key Components of Observability
Observability in DevOps is typically built on three main pillars.
Metrics
Metrics are numerical values that represent system performance over time.
Examples include:
- CPU usage
- Memory consumption
- Network latency
- Request response time
Metrics help identify performance trends and anomalies.
Logs
Logs are records of events generated by applications or infrastructure.
Example log entries may include:
- Error messages
- Authentication attempts
- System events
- API requests
Logs provide detailed information about system behavior.
Distributed Traces
Distributed tracing tracks how requests move through multiple services in a distributed system.
Example:
User request → API gateway → authentication service → database → response
Tracing helps engineers identify bottlenecks across microservices.
Popular Observability DevOps Tools
Several tools help DevOps teams implement observability.
Prometheus
Prometheus is a popular open-source monitoring and observability platform.
Features include:
- Metrics collection
- Time-series database
- Powerful query language
- Alert management
Prometheus is widely used in Kubernetes environments.
Grafana
Grafana is a visualization platform used to create dashboards for monitoring data.
It integrates with many observability tools such as:
- Prometheus
- Elasticsearch
- InfluxDB
Grafana dashboards help teams visualize system performance.
ELK Stack
The ELK stack includes:
- Elasticsearch
- Logstash
- Kibana
This stack is commonly used for centralized log management.
Jaeger
Jaeger is a distributed tracing system designed for microservices environments.
It helps engineers understand how requests move through multiple services.
Datadog
Datadog is a cloud-based observability platform that provides monitoring, logging, and tracing capabilities in one platform.
How Observability Supports DevOps Workflows
Observability plays an important role across the entire DevOps lifecycle.
During Development
Developers can identify performance issues early in the development stage.
Observability tools allow engineers to test applications and analyze system behavior before deployment.
During Deployment
Observability tools help monitor deployments in real time.
If issues occur after deployment, teams can quickly detect and roll back changes.
During Production Operations
In production environments, observability ensures continuous monitoring of system performance.
This helps teams maintain reliability and uptime.
Implementing Observability in DevOps
Adopting observability requires careful planning and the right tools.
Step 1 Define Key Metrics
Identify the most important metrics for your application.
Examples include:
- Request latency
- Error rates
- CPU usage
- Database performance
Step 2 Centralize Logs
Collect logs from all services and store them in a centralized platform.
This makes troubleshooting easier.
Step 3 Implement Distributed Tracing
Tracing helps track requests across multiple services in microservices architectures.
Step 4 Create Dashboards
Use dashboards to visualize system metrics and identify performance trends.
Step 5 Configure Alerts
Alerts notify teams when system metrics exceed acceptable thresholds.
Observability in Cloud Native Environments
Cloud-native applications often run in containerized environments such as Kubernetes.
Observability becomes critical because:
- Services scale dynamically
- Infrastructure changes frequently
- Systems are highly distributed
Observability tools help track performance across containers, nodes, and services.
Best Practices for Observability in DevOps
Standardize Logging Formats
Consistent logging formats improve searchability and analysis.
Automate Monitoring
Integrate observability tools with CI/CD pipelines to automate monitoring.
Use Distributed Tracing
Tracing provides visibility into complex microservices architectures.
Continuously Review Metrics
Regularly analyze metrics to identify performance improvements.
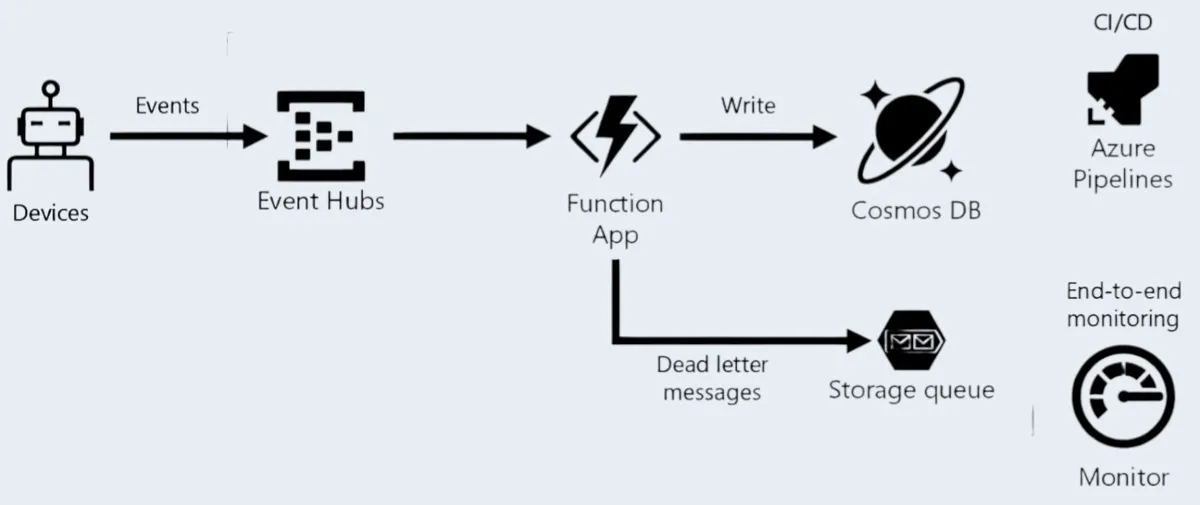
Real World Example of Observability in DevOps
Consider an ecommerce platform running microservices.
Infrastructure includes:
- API gateway
- payment service
- authentication service
- product service
- database cluster
After deployment, customers report slow checkout processes.
Using observability tools:
- Metrics show increased response time
- Logs reveal database query errors
- Distributed traces identify slow payment service calls
Engineers fix the issue quickly, improving system performance.
Short Summary
Observability is a critical component of modern DevOps practices. By analyzing metrics, logs, and traces, teams gain deep insights into system performance and behavior.
With the help of observability DevOps tools, engineers can detect incidents faster, diagnose problems efficiently, and maintain reliable systems in complex distributed environments.
Conclusion
As software systems become more distributed and complex, observability has become a core requirement for successful DevOps practices.
By implementing the right observability tools and strategies, organizations can gain deep visibility into their infrastructure and applications. This enables teams to troubleshoot issues faster, improve system reliability, and deliver better user experiences.
Observability is no longer optional. It is an essential capability for building resilient, scalable, and high-performing DevOps systems.
Frequently Asked Questions
Observability DevOps tools help engineers monitor system metrics, logs, and traces to understand system behavior and troubleshoot issues effectively.