Introduction
Serverless computing has transformed the way modern applications are built and deployed. Developers can now run code without managing servers, scale applications automatically, and focus entirely on building features instead of maintaining infrastructure. Platforms such as AWS Lambda, Google Cloud Functions, and Azure Functions have made serverless architectures increasingly popular.
However, while serverless simplifies infrastructure management, it introduces a new challenge: monitoring and observability.
In traditional applications, developers could monitor servers, processes, and system metrics. But in serverless environments, infrastructure is abstracted away. Functions run for milliseconds, scale instantly, and disappear after execution. This makes troubleshooting and performance monitoring more complex.
This is where serverless monitoring devops practices become critical.
A strong monitoring strategy ensures that serverless applications remain reliable, performant, and secure. Without proper monitoring, teams may struggle to identify errors, performance bottlenecks, or unexpected costs.
In this comprehensive guide, you will learn:
- What serverless monitoring is
- Why monitoring serverless applications is important
- Key challenges in serverless observability
- Metrics and logs you should track
- Tools used for serverless monitoring in DevOps
- Best practices for building reliable monitoring systems
By the end of this article, you will understand how to implement an effective serverless monitoring devops strategy that helps maintain healthy serverless applications.
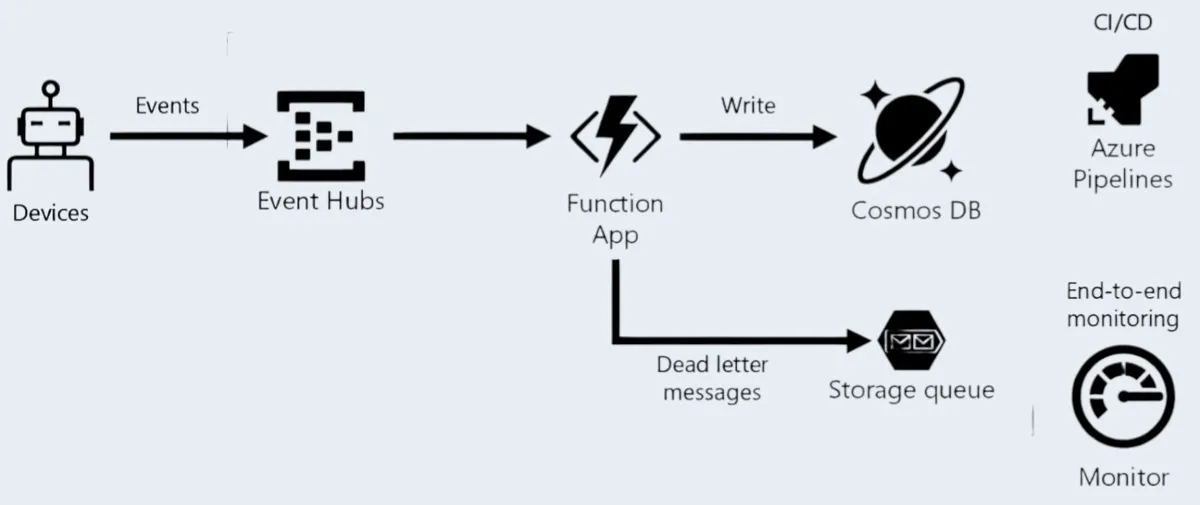
Understanding Serverless Architecture
Before diving into monitoring strategies, it is important to understand how serverless architectures work.
Serverless computing allows developers to deploy code in the form of functions that run in response to events.
Examples of triggers include:
- HTTP requests
- File uploads
- Database updates
- Message queues
- Scheduled tasks
Instead of managing servers, the cloud provider handles:
- Infrastructure provisioning
- Scaling
- Availability
- Runtime environments
Popular serverless platforms include:
- AWS Lambda
- Google Cloud Functions
- Azure Functions
This architecture allows developers to focus on application logic while the platform manages infrastructure.
Why Monitoring Serverless Applications is Important
Monitoring plays a critical role in DevOps because serverless systems are highly distributed and event driven.
Without proper monitoring, teams may face challenges such as:
- Hidden performance bottlenecks
- Silent failures
- Unexpected scaling costs
- Difficulty debugging production issues
A strong serverless monitoring devops strategy helps teams achieve several benefits.
Faster Issue Detection
Monitoring tools detect failures immediately so teams can resolve issues before users are affected.
Improved Performance
Performance metrics help identify slow functions and optimize execution time.
Cost Optimization
Serverless platforms charge based on execution time and requests. Monitoring helps track resource usage.
Better Reliability
Continuous monitoring ensures applications remain stable even under heavy load.
Challenges in Serverless Monitoring
Monitoring serverless systems is different from traditional infrastructure monitoring.
Short Lived Functions
Serverless functions may run for only a few milliseconds. Traditional monitoring tools designed for long running servers may not capture these events effectively.
Lack of Infrastructure Visibility
Cloud providers manage the underlying infrastructure, which means developers cannot monitor servers directly.
Distributed Architecture
Serverless applications often consist of multiple functions interacting with APIs, databases, and external services.
Tracking the entire request flow becomes complex.
Cold Starts
Cold starts occur when a serverless function runs for the first time or after a period of inactivity.
Monitoring cold start latency is important for performance optimization.
Key Metrics for Serverless Monitoring
To implement an effective serverless monitoring devops strategy, teams must track specific metrics.
Function Invocation Metrics
These metrics show how often functions are executed.
Important indicators include:
- Invocation count
- Request rate
- Traffic patterns
These metrics help understand application usage.
Execution Time
Execution duration measures how long a function takes to run.
Long execution times may indicate inefficient code or resource constraints.
Monitoring execution duration helps optimize performance.
Error Rates
Error metrics track the number of failed function executions.
Common serverless errors include:
- Timeout errors
- Runtime exceptions
- Dependency failures
High error rates indicate system instability.
Cold Start Latency
Cold start time measures how long it takes for a function to initialize.
Cold starts can increase response time.
Monitoring cold starts helps teams optimize startup performance.
Resource Usage
Serverless functions allocate resources such as memory and CPU.
Monitoring resource usage ensures functions have adequate resources.
Logging in Serverless Applications
Logging is a critical component of serverless observability.
Logs provide detailed insights into application behavior.
Application Logs
Application logs record events generated by the application code.
Examples include:
- Error messages
- Debug information
- API responses
Logs help developers understand system behavior.
Infrastructure Logs
Infrastructure logs capture platform level events such as:
- Function initialization
- Scaling events
- System errors
These logs help diagnose infrastructure issues.
Distributed Tracing in Serverless Systems
Modern serverless applications often consist of many interconnected services.
Distributed tracing allows teams to track requests across multiple components.
How Distributed Tracing Works
Tracing assigns a unique identifier to each request.
As the request travels through services, the trace collects performance data.
This helps identify:
- Slow services
- Failed requests
- Performance bottlenecks
Tracing tools are essential for debugging complex serverless systems.
Tools for Serverless Monitoring in DevOps
Several tools help implement serverless monitoring devops practices.
AWS CloudWatch
CloudWatch is AWS native monitoring tool.
It provides:
- Logs and metrics
- Function performance monitoring
- Alerts and dashboards
Datadog
Datadog provides full observability for serverless applications.
Features include:
- Distributed tracing
- Real time monitoring
- Performance analytics
New Relic
New Relic offers monitoring capabilities for cloud native applications.
It provides detailed performance insights and error tracking.
Prometheus
Prometheus is an open source monitoring system used for collecting metrics.
It integrates well with cloud native architectures.
Step by Step Monitoring Strategy for Serverless Applications
Implementing a strong monitoring strategy requires several steps.
Step 1 Define Monitoring Goals
Identify what metrics and logs are most important.
Examples include:
- Error rates
- Response times
- Resource usage
Step 2 Enable Logging
Configure logging for all serverless functions.
Logs should include useful debugging information.
Step 3 Collect Metrics
Use monitoring tools to track system performance metrics.
Step 4 Implement Alerts
Set up alerts for critical events such as:
- High error rates
- Slow response times
- Resource limits exceeded
Step 5 Analyze and Improve
Continuously analyze monitoring data to improve application performance.
Best Practices for Serverless Monitoring
Successful DevOps teams follow several monitoring best practices.
Implement Centralized Logging
Centralized logging makes it easier to analyze system behavior.
Use Structured Logs
Structured logs improve searchability and analysis.
Monitor End to End Workflows
Monitoring should track the entire request flow across services.
Track Cost Metrics
Serverless monitoring should include cost tracking.
Automate Alerts
Automated alerts help teams respond quickly to issues.
Common Monitoring Mistakes
Even experienced teams make mistakes when monitoring serverless applications.
Ignoring Cold Start Performance
Cold starts can significantly impact performance.
Insufficient Logging
Poor logging makes troubleshooting difficult.
Lack of Alerting
Without alerts, teams may not detect issues until users report them.
Monitoring Only Infrastructure
Monitoring should focus on application performance rather than just infrastructure metrics.
Short Summary
Monitoring serverless applications is essential for maintaining reliability, performance, and cost control.
A well designed serverless monitoring devops strategy includes metrics tracking, logging, distributed tracing, and automated alerts.
By implementing proper monitoring systems, teams can detect issues early and ensure serverless applications run smoothly.
Conclusion
Serverless computing has revolutionized application development by eliminating infrastructure management and enabling automatic scaling. However, this abstraction introduces new monitoring challenges.
A strong serverless monitoring devops strategy helps teams maintain visibility into application performance, detect errors quickly, and optimize system reliability.
By combining logging, metrics, tracing, and monitoring tools, DevOps teams can build highly observable serverless systems that support modern cloud native applications.
Investing in effective monitoring is essential for delivering reliable serverless applications at scale.
Frequently Asked Questions
Serverless monitoring refers to tracking metrics, logs, and performance data for serverless functions and cloud native applications.