Introduction: Why DevOps Reporting Is the Backbone of Continuous Improvement
Imagine running multiple CI CD pipelines, deploying microservices daily, handling cloud infrastructure, and managing dozens of engineers — but having no clear visibility into performance.
You don’t know:
- How long deployments take
- Why builds fail repeatedly
- Which services cause downtime
- Where bottlenecks exist
Without proper reporting, DevOps becomes guesswork.
That’s why understanding devops reporting tools is critical for modern engineering teams.
Reporting tools help teams measure performance, improve delivery speed, monitor infrastructure health, track incidents, and optimize collaboration.
In this comprehensive guide, you will learn:
- What DevOps reporting tools are
- Why they matter in CI CD pipelines
- Key metrics every team should track
- Top DevOps reporting tools available today
- How to choose the right reporting solution
- Best practices for implementing reporting systems
Whether you’re a beginner exploring DevOps or a professional managing enterprise pipelines, this guide will help you build a strong reporting strategy.
What Are DevOps Reporting Tools?
DevOps reporting tools are software solutions that collect, analyze, and visualize data from development and operations workflows.
They generate reports on:
- Build performance
- Deployment frequency
- Incident response
- Infrastructure metrics
- Code quality
- Security vulnerabilities
These tools provide actionable insights that improve decision-making.
Why DevOps Reporting Is Important
DevOps is built around automation, collaboration, and continuous improvement.
Without reporting:
- You cannot measure progress
- You cannot detect recurring failures
- You cannot optimize pipelines
- You cannot justify improvements to stakeholders
Key Benefits of DevOps Reporting
- Improved deployment speed
- Reduced downtime
- Better team productivity
- Enhanced security visibility
- Data-driven decision making
Reporting transforms DevOps from reactive to proactive.
Key DevOps Metrics You Should Track
Before choosing tools, understand the metrics.
Deployment Frequency
How often code is deployed to production.
Higher frequency indicates mature DevOps practices.
Lead Time for Changes
Time between code commit and deployment.
Lower lead time means faster innovation.
Mean Time to Recovery MTTR
Time required to recover from failures.
Short MTTR improves system reliability.
Change Failure Rate
Percentage of deployments causing failures.
Lower rate means better stability.
These metrics are commonly associated with high-performing DevOps teams.
Categories of DevOps Reporting Tools
DevOps reporting tools fall into different categories.
CI CD Reporting Tools
Provide pipeline performance insights.
Monitoring and Observability Tools
Track infrastructure and application metrics.
Log Analysis Tools
Analyze system logs for troubleshooting.
Project and Workflow Reporting Tools
Measure team productivity and sprint velocity.
Security Reporting Tools
Track vulnerabilities and compliance.
Understanding categories helps you build a complete reporting ecosystem.
Top DevOps Reporting Tools You Should Know
Jenkins Reporting
Jenkins provides pipeline dashboards showing:
- Build success rate
- Build duration
- Test results
It integrates with plugins for advanced reporting.
Best for: CI automation visibility.
GitLab Insights
GitLab offers built-in DevOps analytics including:
- Deployment frequency
- Cycle time
- Merge request metrics
Best for: Integrated DevOps lifecycle management.
Azure DevOps Reporting
Azure DevOps includes:
- Pipeline dashboards
- Release tracking
- Work item reporting
Best for: Enterprise project management.
Grafana
Grafana visualizes metrics from various sources.
It integrates with monitoring systems to display:
- CPU usage
- Memory consumption
- Application performance
Best for: Real-time performance dashboards.
Prometheus
Prometheus collects and stores metrics for monitoring.
It integrates with Grafana for visualization.
Best for: Infrastructure monitoring.
Datadog
Datadog provides:
- Cloud monitoring
- Log management
- Security insights
- APM reporting
Best for: Full-stack observability.
ELK Stack
Elasticsearch, Logstash, and Kibana form a log analytics platform.
Used for:
- Log analysis
- Incident tracking
- Root cause identification
Best for: Log-based reporting.
Comparison of Popular DevOps Reporting Tools
| Tool | Best For | Strength |
|---|---|---|
| Jenkins | CI Reporting | Plugin ecosystem |
| GitLab | End-to-end DevOps | Built-in analytics |
| Grafana | Visualization | Custom dashboards |
| Prometheus | Monitoring | Time-series metrics |
| Datadog | Observability | Cloud-native support |
| ELK Stack | Log analysis | Deep search capabilities |
Selecting tools depends on infrastructure and team needs.
How to Choose the Right DevOps Reporting Tool
Step 1: Identify Your Goals
Are you tracking:
- Pipeline performance
- Infrastructure metrics
- Security compliance
- Developer productivity
Define priorities first.
Step 2: Evaluate Integration Capability
Choose tools that integrate with:
- Kubernetes
- Cloud providers
- CI CD platforms
- Version control systems
Integration reduces manual effort.
Step 3: Check Scalability
Ensure tools handle:
- Large data volumes
- Multiple microservices
- Distributed systems
Scalability is critical for enterprise environments.
Step 4: Assess Cost
Some tools are open source. Others require subscriptions.
Balance budget with features.
Real-World DevOps Reporting Example
Imagine an ecommerce company deploying daily updates.
Problem:
- Deployment failures increasing
- High customer complaints
- Long recovery times
Solution:
- Implement monitoring dashboards
- Track deployment frequency
- Analyze failure patterns
- Improve rollback strategy
Result:
- Reduced failure rate
- Faster recovery
- Increased customer satisfaction
Data-driven insights improve outcomes.
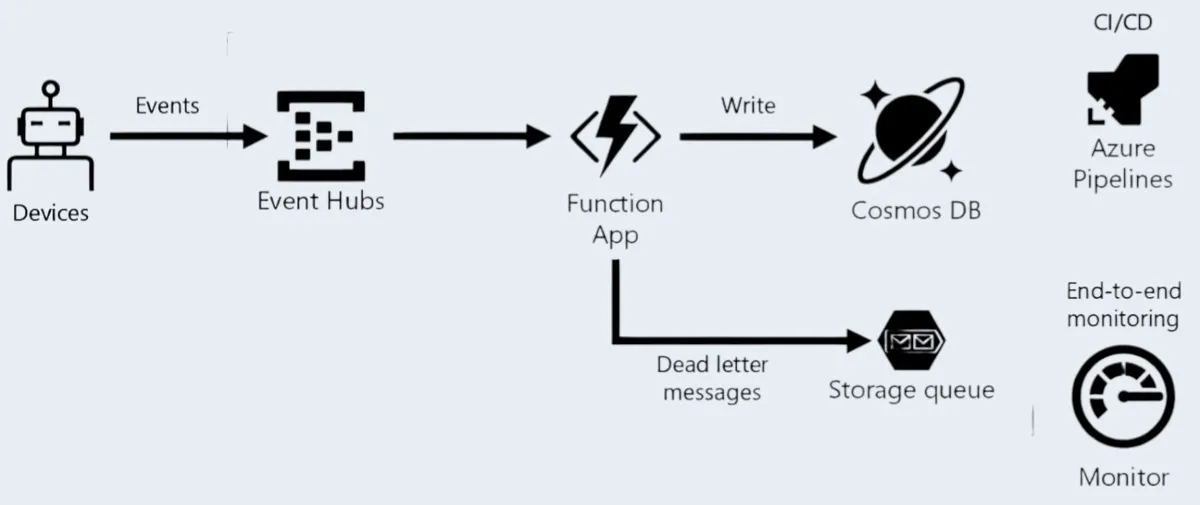
DevOps Reporting in Kubernetes Environments
Kubernetes requires advanced reporting.
Tools often track:
- Pod health
- Node resource usage
- Cluster scaling events
- Container restarts
Combining Prometheus and Grafana provides powerful reporting capabilities.
DevOps Reporting for Security and Compliance
Security reporting tools track:
- Vulnerabilities
- Dependency risks
- Access control changes
- Audit logs
Security reporting ensures compliance with industry standards.
Common Mistakes in DevOps Reporting
Tracking too many metrics
Ignoring actionable insights
Not sharing dashboards with teams
Failing to automate reporting
Not reviewing reports regularly
Focus on meaningful metrics only.
Advanced DevOps Reporting Strategies
Centralized Dashboarding
Combine metrics from multiple tools into unified dashboards.
Automated Alerts
Receive notifications when metrics exceed thresholds.
Predictive Analytics
Use historical data to forecast performance issues.
Executive Reporting
Translate technical metrics into business insights.
Advanced reporting improves strategic planning.
Future of DevOps Reporting Tools
DevOps reporting continues evolving with:
- AI-powered analytics
- Cloud-native monitoring
- Real-time anomaly detection
- Observability-driven development
Future tools will provide deeper insights with less manual configuration.
Actionable Tips for Beginners
Start with simple dashboards
Track deployment frequency
Monitor build duration
Automate alerts
Review metrics weekly
Continuously optimize
Small improvements create big impact.
Short Summary
DevOps reporting tools provide visibility into:
- Pipeline performance
- Infrastructure health
- Deployment success
- Security risks
They enable data-driven decision-making and continuous improvement.
Conclusion: Measure What Matters
In DevOps, improvement starts with measurement.
Without proper reporting, teams operate blindly. By implementing the right devops reporting tools, organizations gain visibility, optimize processes, reduce failures, and improve reliability.
Whether you use Jenkins dashboards, Grafana visualizations, or enterprise observability platforms, reporting is essential to DevOps maturity.
Start tracking meaningful metrics today and build a culture of continuous improvement.
Frequently Asked Questions
DevOps reporting tools collect and visualize data related to CI CD pipelines, infrastructure performance, and deployment metrics.