Introduction: Why DevOps Metrics Define Success in 2026
In 2026, software is no longer released once every few months. It's deployed multiple times per day. Infrastructure is automated. Applications are cloud-native. Security is integrated from day one. In this fast-moving ecosystem, intuition is not enough --- data drives everything.
That's where devops key metrics come into play.
Organizations that measure the right DevOps performance indicators outperform competitors in speed, reliability, and customer satisfaction. Those who ignore metrics often struggle with production outages, delayed releases, and frustrated engineering teams.
But here's the challenge: not all metrics matter.
Tracking the wrong numbers can create noise instead of clarity. This guide will walk you through the DevOps Metrics That Matter in 2026, including:
- Core performance metrics (DORA)
- Reliability and observability metrics
- Security-focused DevSecOps metrics
- Cost optimization KPIs
- Developer productivity indicators
- Step-by-step implementation guidance
- Practical examples and FAQs
Let's explore what modern DevOps success really looks like.
What Are DevOps Key Metrics?
DevOps key metrics are measurable indicators used to evaluate:
- Software delivery speed\
- Deployment reliability\
- Infrastructure performance\
- Incident response efficiency\
- Team productivity\
- Security posture
They provide visibility into both technical performance and business outcomes.
In 2026, companies rely heavily on:
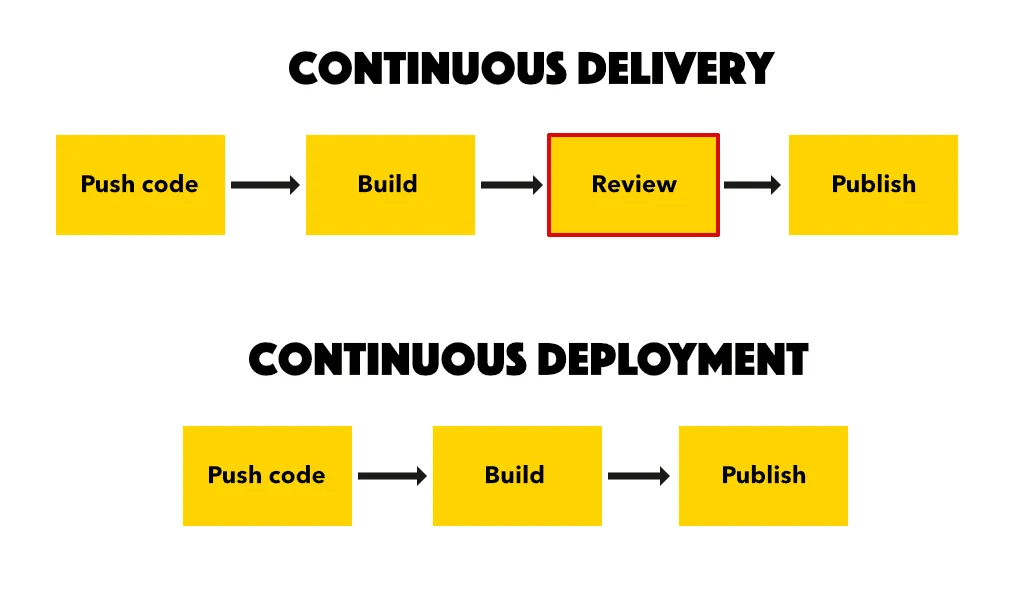
- Continuous Integration (CI)
- Continuous Deployment (CD)
- Infrastructure as Code (IaC)
- Cloud-native architectures
- Microservices
- Observability platforms
Each of these areas generates data. The key is knowing which data actually matters.
Core DevOps Key Metrics (The DORA Framework)
The foundation of modern DevOps measurement still revolves around DORA metrics. These remain highly relevant in 2026.
1. Deployment Frequency
Definition: How often your team deploys code to production.
Why It Matters
Higher deployment frequency typically indicates:
- Smaller, safer changes\
- Faster feedback loops\
- Strong CI/CD pipelines\
- Agile engineering culture
Example
- Elite teams: Multiple deployments per day\
- Low-performing teams: One deployment per month
How to Improve Deployment Frequency
- Automate testing\
- Reduce manual approvals\
- Break large changes into smaller releases\
- Use feature flags
Deployment frequency remains one of the most important devops key metrics because it directly reflects agility.
2. Lead Time for Changes
Definition: Time from code commit to production release.
Shorter lead times mean faster value delivery.
Key Influencing Factors
- Code review process\
- Test automation quality\
- Pipeline efficiency\
- Infrastructure provisioning speed
Actionable Tip
Map your deployment pipeline visually and identify bottlenecks. Most teams discover unnecessary waiting stages.
3. Change Failure Rate
Definition: Percentage of deployments that cause incidents or require rollback.
For example: - 100 deployments\
- 12 cause production issues\
- Failure rate = 12%
Why This Metric Matters
It balances speed with stability.
If deployment frequency increases but failure rate spikes, your process is unstable.
Ways to Reduce Failure Rate
- Implement canary releases\
- Use automated regression testing\
- Conduct peer code reviews\
- Adopt blue-green deployment
This metric is central when evaluating DevOps Metrics That Matter in 2026.
4. Mean Time to Recovery (MTTR)
Definition: Average time to restore service after an incident.
Customers expect minimal downtime in 2026. A long MTTR damages trust and revenue.
How to Improve MTTR
- Use centralized logging\
- Implement real-time monitoring\
- Create incident response playbooks\
- Automate rollback mechanisms
MTTR reflects operational maturity.
Reliability and Observability Metrics
Beyond DORA, modern DevOps demands deeper insight into system behavior.
5. Service Level Objectives (SLOs)
SLOs define internal performance targets such as:
- 99.9% uptime\
- API response time under 200ms\
- Error rate below 0.1%
Tracking SLO compliance ensures user experience consistency.
6. Error Rate Monitoring
Measure:
- HTTP 500 errors\
- Timeout frequency\
- Failed transactions\
- Microservice communication errors
High error rates indicate:
- Code defects\
- Infrastructure instability\
- Network issues
Error monitoring is one of the most practical devops key metrics.
7. Latency and Performance Metrics
Performance directly affects customer retention.
Track:
- Average response time\
- 95th percentile latency\
- Database query time\
- Page load performance
In e-commerce, even 1-second delay can reduce conversions significantly.
Infrastructure and Cost Optimization Metrics
Cloud spending in 2026 is substantial. Efficient infrastructure management is critical.
8. Infrastructure Utilization
Measure:
- CPU utilization\
- Memory consumption\
- Disk I/O\
- Network throughput
Under-utilized resources waste money. Over-utilized systems cause downtime.
9. Cloud Cost per Deployment
Track cost efficiency by calculating:
- Infrastructure cost per release\
- Cost per active user\
- Cost per transaction
This aligns DevOps with business profitability.
10. Infrastructure Drift Detection
Configuration drift happens when infrastructure changes manually outside automation.
Tracking drift ensures:
- Compliance\
- Security\
- Reproducibility
DevSecOps Metrics: Security in DevOps
Security is no longer separate from DevOps.
11. Vulnerability Detection Time
How quickly are vulnerabilities identified after code commit?
Short detection time reduces risk exposure.
12. Patch Deployment Time
How fast are critical patches applied?
Slow patching can lead to breaches.
13. Security Incident Rate
Measure:
- Number of security incidents per month\
- Severity levels\
- Resolution time
Security-focused devops key metrics protect brand reputation.
Developer Productivity Metrics
DevOps success depends on engineering efficiency.
14. Pull Request Cycle Time
Measure time from PR creation to merge.
Long review times slow innovation.
15. Code Review Turnaround Time
Faster reviews improve lead time.
16. Developer Context Switching
Frequent interruptions reduce productivity.
Track time spent on:
- Bug fixing\
- Emergency incidents\
- Unplanned work
High incident frequency reduces innovation output.
Step-by-Step: Implementing DevOps Key Metrics in 2026
Many organizations collect data but fail to use it effectively.
Step 1: Align Metrics with Business Goals
Ask:
- Are we prioritizing speed?\
- Stability?\
- Cost reduction?\
- Compliance?
Metrics must support business strategy.
Step 2: Start with Core Metrics
Begin with:
- Deployment frequency\
- Lead time\
- Change failure rate\
- MTTR
Expand gradually.
Step 3: Integrate Monitoring Tools
Use:
- CI/CD dashboards\
- Observability platforms\
- Log management systems\
- Cloud monitoring tools
Centralized visibility increases trust in data.
Step 4: Create Transparent Dashboards
Visibility encourages accountability.
Share dashboards across:
- Engineering\
- Operations\
- Leadership
Step 5: Analyze Trends, Not Snapshots
Single data points mislead.
Track:
- Weekly trends\
- Monthly improvements\
- Quarterly comparisons
Continuous improvement is the goal.
Real-World Case Study
A fintech startup in 2026 struggled with:
- Slow releases\
- Frequent outages\
- High cloud costs
After implementing structured devops key metrics tracking:
Initial Findings:
- Deployment frequency: Twice per month\
- Change failure rate: 22%\
- MTTR: 4 hours\
- CPU utilization: 40% (over-provisioned)
Actions Taken:
- Automated regression testing\
- Reduced batch deployment size\
- Implemented auto-scaling\
- Improved monitoring
Results in 6 Months:
- Deployment frequency: Daily\
- Failure rate: Reduced to 8%\
- MTTR: 30 minutes\
- Cloud cost reduced by 18%
Metrics transformed chaos into clarity.
Common Mistakes When Measuring DevOps
Avoid these pitfalls:
- Tracking Too Many Metrics\
- Using Metrics for Blame\
- Ignoring Customer Impact\
- Not Reviewing Regularly
Short Summary
The most important DevOps Metrics That Matter in 2026 include:
- Deployment Frequency\
- Lead Time for Changes\
- Change Failure Rate\
- Mean Time to Recovery\
- Service Reliability (SLOs)\
- Error Rates & Latency\
- Infrastructure Utilization\
- Security Metrics\
- Developer Productivity Indicators
Tracking the right devops key metrics ensures faster releases, stable systems, lower costs, and better customer experiences.
Conclusion: Measure Smart, Scale Faster
DevOps in 2026 is about balance --- speed, stability, security, and cost efficiency.
Organizations that succeed:
- Measure the right data\
- Align metrics with business goals\
- Embrace transparency\
- Continuously optimize
DevOps is not just about automation --- it's about intelligent measurement.
If you want high-performing teams and reliable systems, focus on the devops key metrics that truly matter.
Measure wisely. Improve consistently. Deliver confidently.
FAQs (Schema-Friendly)
What are the most important devops key metrics in 2026?
The most important devops key metrics include deployment frequency, lead time for changes, change failure rate, mean time to recovery (MTTR), service reliability, and infrastructure utilization.
Why are DORA metrics still relevant in 2026?
DORA metrics directly measure software delivery performance and operational stability, making them foundational DevOps indicators.
How often should DevOps metrics be reviewed?
Operational metrics should be reviewed weekly, while strategic performance trends should be analyzed monthly or quarterly.
Can DevOps metrics improve business outcomes?
Yes. By reducing downtime, improving deployment speed, and optimizing cloud costs, DevOps metrics directly impact revenue and customer satisfaction.
How do you choose the right DevOps metrics?
Start by aligning metrics with business goals, focus on core performance indicators, and gradually expand into reliability, security, and cost metrics.