Introduction
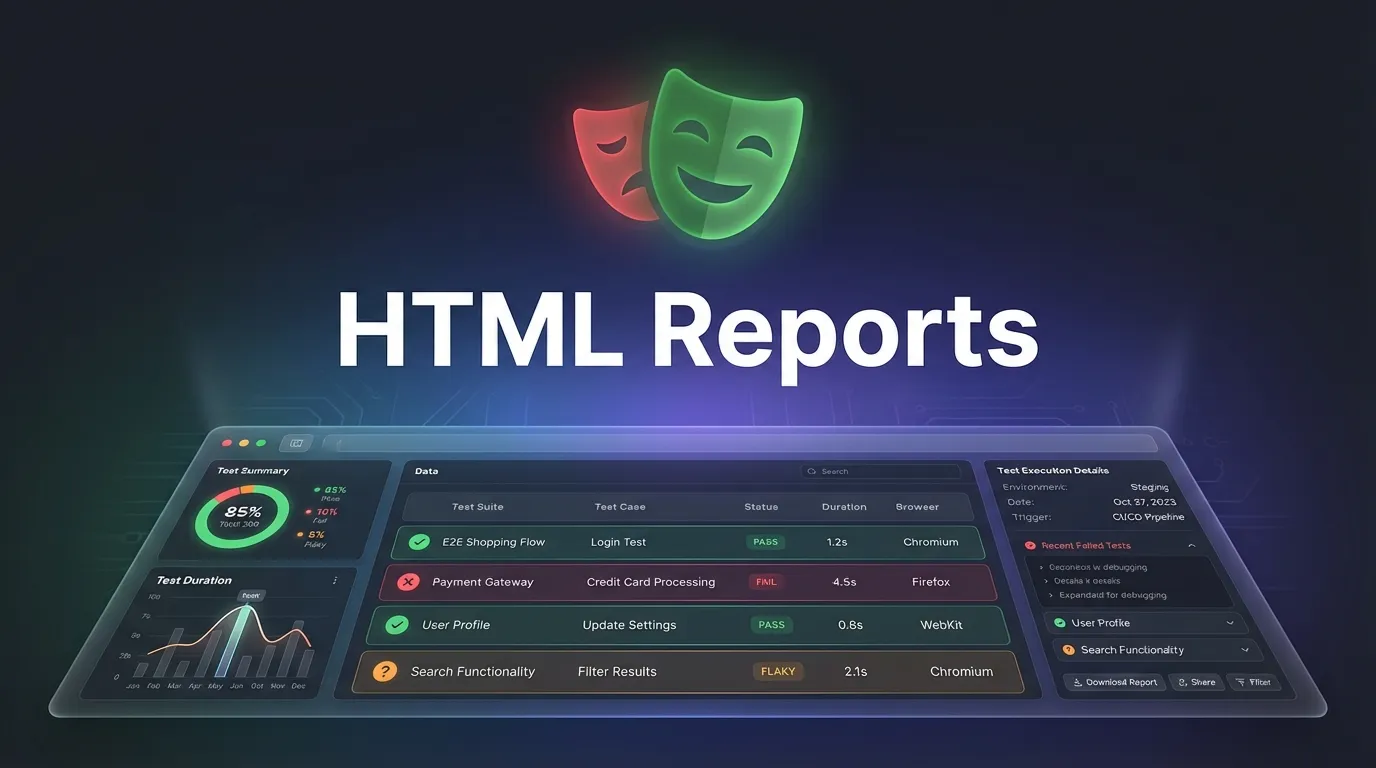
Imagine running automated tests and instantly seeing a beautiful, interactive dashboard showing exactly what passed, what failed, and why. No guesswork. No digging through logs. Just clear, visual insights.
That’s the power of playwright html reports.
In modern test automation, especially in CI CD environments, simply knowing whether tests passed or failed is not enough. You need context, visuals, and deep debugging insights. Playwright’s HTML reporting system provides exactly that making it one of the most powerful features of the framework.
With playwright html reports, you can:
- Visualize test execution results
- Debug failures with screenshots and traces
- Analyze test performance
- Share reports with your team
In this complete Playwright HTML Reports Setup guide, you will learn:
- What Playwright HTML reports are
- How to generate and configure them
- Step by step setup process
- Advanced customization techniques
- Best practices for real world usage
Whether you are a beginner, QA engineer, or automation expert, this guide will help you master Playwright reporting like a pro.
Using playwright html reports offers several advantages.
Better Debugging
You can visually see where the test failed.
Improved Readability
Interactive UI makes analysis easier.
Faster Issue Resolution
Screenshots and traces reduce debugging time.
Team Collaboration
Reports can be shared easily.
Let’s go step by step.
Step 2 Run Tests
npx playwright test
Output
- Interactive dashboard
- Test summary
- Detailed logs
- Screenshots and videos
Test Summary
Shows:
- Total tests
- Passed tests
- Failed tests
- Skipped tests
Attachments
Includes:
- Screenshots
- Videos
- Trace files
You can customize report behavior in config.
Options Explained
outputFolder
Defines where reports are saved.
open
Controls when report opens:
- always
- never
- on-failure
Change Report Folder
['html', { outputFolder: 'reports' }]
Open Only on Failure
['html', { open: 'on-failure' }]
Example
await page.screenshot({ path: 'failure.png' })
Benefits
- Replay test execution
- Identify UI issues
- Improve debugging
Enable Trace
use: {
  trace: 'on'
}
What You See
- Step by step execution
- DOM changes
- Network activity
Using HTML Reports in CI CD
Reports can be integrated into pipelines.
Benefits
- Access reports remotely
- Debug failures easily
- Share results with teams
Common Issues and Solutions
Large Report Size
Solution
- Disable videos
- Limit trace usage
Best Practices for Playwright HTML Reports
Capture Data Only on Failure
Reduces storage usage.
Clean Old Reports
Prevents storage issues.
Advanced Tips
- Use custom dashboards
- Integrate with Slack notifications
- Analyze report trends
- Combine with performance testing
Conclusion
Playwright HTML reports are one of the most powerful tools in modern test automation.
They transform raw test results into meaningful insights making debugging faster and collaboration easier.
By mastering playwright html reports you can:
- Quickly identify failures
- Improve automation efficiency
- Enhance team productivity
- Build reliable testing pipelines
Feature Image
https://images.unsplash.com/photo-1555066931-4365d14bab8c