Case Study: Automating the CI/CD Pipeline for High-Frequency Deployments (2026)
In the enterprise technology landscape of 2026, the interval between a developer’s "commit" and the user’s "consumption" has shrunk from weeks to minutes. For "CloudScale," a fictional global SaaS provider specializing in real-time supply chain analytics, the goal was audacious: move from daily deployments to a continuous stream of 100+ production releases per day without sacrificing the 99.999% reliability required by their Fortune 500 clients.
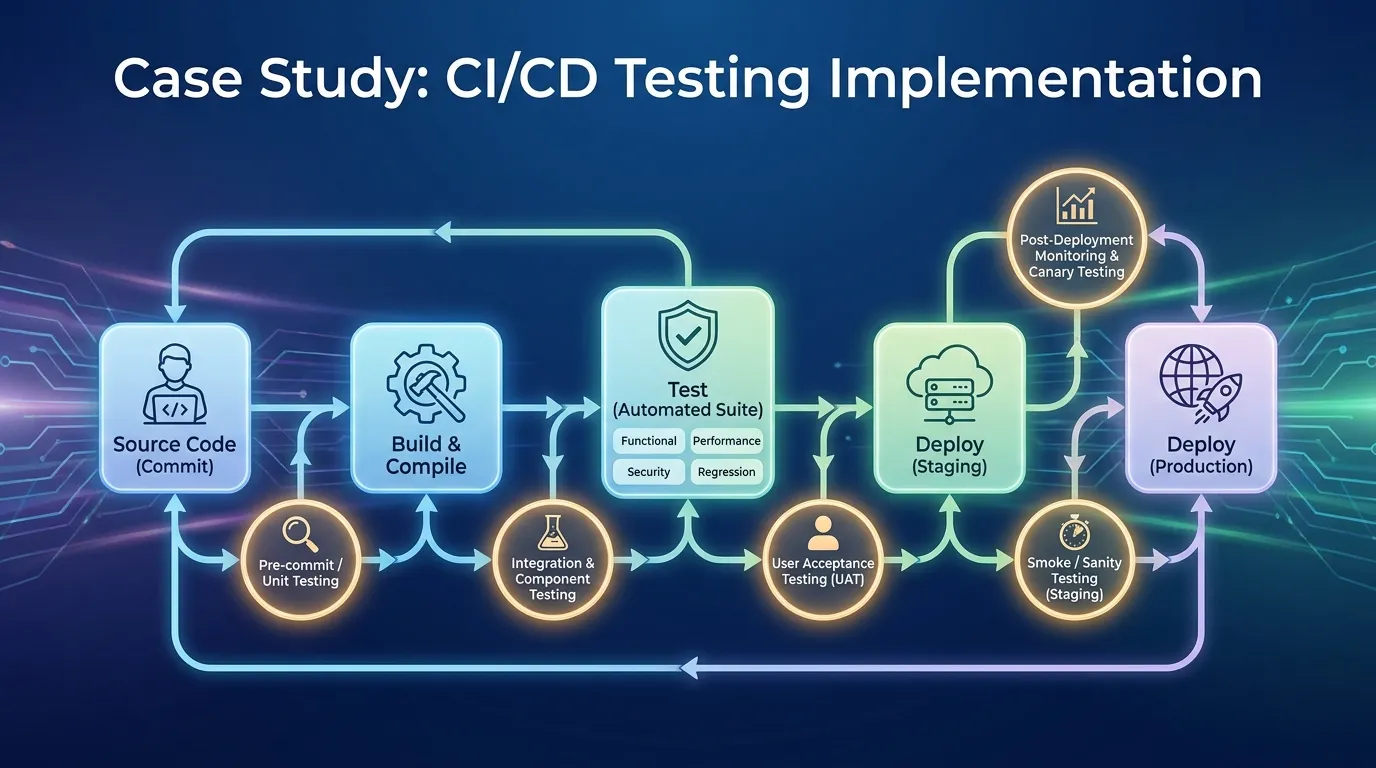
This case study in CI/CD testing implementation explores how CloudScale re-engineered its pipeline from a linear bottleneck into a parallelized, intelligent validation engine.
1. The Challenge: The "Quality Wall"
Before the transformation, CloudScale’s pipeline was hitting a "Quality Wall."
- The Problem: The "Regression Suite" took 6 hours to run. With 20 developer teams merging code simultaneously, the CI queue was constantly backed up, leading to "Merge Hell" and stale code.
- The Fragility: Because the full suite was too slow, teams were cherry-picking tests, leading to critical regressions leaking into the staging and production environments.
- The Impact: Mean Time to Recovery (MTTR) was rising because when a deployment failed, it was difficult to identify which of the 50 merged commits caused the issue.
2. Phase 1: Intelligent Test Orchestration (The 15-Minute Rule)
The leadership team established a non-negotiable directive: The "Pre-Merge" pipeline must provide comprehensive feedback in under 15 minutes.
1. Test Impact Analysis (TIA)
- The Strategy: Instead of running all 5,000 tests, CloudScale implemented Test Impact Analysis.
- The Engineering: By mapping the code graph (using tools like Nx and Bazel), the system identifies exactly which files were modified and runs only the subset of tests that exercise those specific code paths.
- Result: The average test run dropped from 6 hours to 8 minutes for 90% of Pull Requests.
2. Massive Parallelization with Kubernetes
- The Execution: Testing is no longer sequential. CloudScale utilizes dynamic Kubernetes ephemeral runners.
- The Logic: When a PR is created, the CI engine (e.g., GitHub Actions or GitLab CI) spins up 50 isolated containers, each running a small slice of the test suite simultaneously.
3. Phase 2: Automated Quality Gates and "No-Go" Decisions
In 2026, a human should never have to click "Approve" for a deployment to move to production.
1. The "Golden Metrics" Gate
- The Engineering: Every build must pass three strictly defined gates:
- Unit Coverage: 80% coverage on new code (verified via SonarQube).
- Security Scan: Zero high-critical vulnerabilities (verified via Snyk).
- Performance Budget: No more than a 5% increase in API latency (verified via k6).
- Result: 40% of faulty builds are automatically rejected before they ever reach a human reviewer.
2. Error Budgeting (SLO Integration)
- The Logic: If the production "Error Budget" for a service is depleted (e.g., too many recent 5xx errors), the CI/CD pipeline automatically locks, preventing any new feature deployments until the service is stabilized.
4. Phase 3: Blue-Green Deployments and Shadow Testing
Validation doesn't end when the code is deployed. It continues during the "Rollout."
1. Blue-Green Orchestration
- The Strategy: CloudScale uses Argocd for Blue-Green deployments.
- The Verification: The new version (Green) is deployed alongside the old version (Blue). Automated "Smoke Tests" run against the Green environment. If they pass, 10% of real user traffic is shifted.
- The Analysis: If the error rate on the Green environment exceeds the Blue baseline, the traffic is instantly and automatically snapped back to Blue.
2. Shadow Testing (Mirroring)
- The Engineering: For high-risk API changes, CloudScale "Mirrors" 100% of production traffic to the new version in a "Shadow" environment.
- The Verification: The system compares the response of the old and new versions. If the outputs differ in unexpected ways, the deployment is aborted before the user ever sees a single byte from the new code.
5. Phase 4: Observability-Driven Development
In the world of continuous high-frequency deployment, the "Test Report" is the production dashboard.
1. Distributed Tracing in CI
- The Test: Every automated E2E test in the CI pipeline is injected with an OpenTelemetry trace-id.
- The Result: If a test fails, the QA engineer doesn't look at a log file; they look at a Jaeger trace that shows the exact microservice and database query that caused the failure within the ephemeral CI environment.
2. Feedback Loops to Developers
- Strategy: Real-time production performance data is fed back into the developer's IDE (e.g., via New Relic CodeStream).
- Impact: Developers can see the "Performance Cost" of their code while they are writing it, creating a culture of performance-first engineering.
6. Real-World Failure: "The Parallel State Collision"
During the transition to massive parallelization, CloudScale experienced a series of weird "Flaky" failures.
- The Root Cause: Multiple parallel test runners were attempting to use the same "Admin" user in the staging database simultaneously, leading to account-lockout errors.
- The Resolution: The team implemented Isolated Data Buckets. Each parallel test runner is now assigned a unique "Test Tenant" with its own isolated database schema, created and destroyed on the fly.
- Lesson Learned: Parallelization requires a fundamental rethink of shared resource management.
7. Metrics of Success for CloudScale
| Metric | Before Transformation | After CI/CD Automation (2026) |
|---|---|---|
| Deployment Frequency | 1 / Day | 150+ / Day |
| Lead Time for Changes | 4 Days | 45 Minutes |
| Mean Time to Recovery (MTTR) | 3.5 Hours | 9 Minutes |
| Change Failure Rate | 12% | 1.8% |
| Developer Productivity (Hours Saved) | 0 | 4,200 / Month |
8. The Role of Generative AI in the Pipeline
In 2026, CloudScale utilizes AI not just for writing code, but for managing the pipeline itself.
- AI-Triaging: When a build fails, an LLM analyzes the logs, traces, and code changes, and posts a natural-language summary in the developer's Slack: "Hey, your change to the Billing-Service broke the Stripe-Webhook integration; check line 45 of handler.go."
- Predictive Scaling: The CI engine predicts the "Traffic Wave" of developer PRs and pre-warms Kubernetes runners to avoid queue wait times.
2026 CI/CD Testing Checklist
- 15-Minute Feedback: Does your pre-merge pipeline finish in under 15 minutes?
- TIA Integration: Are you using Test Impact Analysis to skip redundant tests?
- Ephemeral Environments: Is every PR tested in a clean, isolated container/tenant?
- Security Gates: Are Snyk/SonarQube scans blocking faulty PRs automatically?
- Blue-Green/Canary: Can you roll back a deployment in under 60 seconds?
- Shadow Testing: Do you validate high-risk changes against mirrored production traffic?
- AI Triaging: Does your CI system provide actionable summaries of test failures?
Summary
- Parallelize or Perish: Sequential testing is the death of velocity; use Kubernetes to run everything at once.
- Shift-Left Decision Making: Use automated quality gates to protect the "Main" branch from faulty code, security holes, and performance regressions.
- Test Impacts, Not Everything: Map your code graph to run only the relevant subsets of your suite.
- Deployment is the Middle, Not the End: Validate during the rollout using Blue-Green and Shadow testing.
- Trace Your Tests: Use OpenTelemetry in your CI pipeline for instant debugging of complex failures.
- Feedback is the Product: The faster the developer knows something is wrong, the faster they can fix it.
Conclusion
The evolution of CloudScale's CI/CD pipeline demonstrates that in 2026, speed and quality are not trade-offs; they are outcomes of the same engine. By embracing intelligent orchestration, automated gates, and deep observability, CloudScale transformed a 6-hour bottleneck into a 15-minute competitive advantage. In the modern enterprise, the pipeline is the heartbeat of the organization. Those who can automate the "Trust" between code and customer are those who will lead the market. The next frontier? Fully self-healing pipelines that not only detect failures but automatically propose and test the fixes.
FAQs
1. What is "Test Impact Analysis" (TIA)? A method of identifying and running only the specific tests that are relevant to a particular code change, rather than running the entire suite.
2. Why is the "15-Minute Rule" important? Because developer focus drops sharply if they have to wait longer than 15 minutes for feedback, leading to multitasking and context-switching.
3. What is an "Ephemeral Environment"? A temporary, isolated testing environment created specifically for a single build or PR and destroyed immediately after the tests are complete.
4. How does Blue-Green deployment improve safety? By allowing you to test the new version in production-like isolation and switch traffic back to the old version instantly if an error is detected.
5. What is "Shadow Testing"? A technique where production traffic is duplicated and sent to a new, non-public version of the system to see how it performs under real-world conditions without affecting users.
6. What is "MTTR" and why does CI/CD improve it? Mean Time to Recovery. CI/CD improves it through small, frequent changes and automated rollback mechanisms that make identifying and fixing errors much faster.
7. Can I use AI for code reviews? Yes. In 2026, AI tools can perform initial logic checks, security scans, and style enforcement, allowing human reviewers to focus on high-level architecture.
8. What is "DORA Metrics"? A set of four key metrics (Deployment Frequency, Lead Time, MTTR, and Change Failure Rate) used to measure the performance of software delivery teams.
9. How do you handle "Flaky Tests" in a high-speed pipeline? By using automated "Quarantine" systems that detect flaky tests, remove them from the blocking path, and alert the team to fix them.
10. What is "Documentation as Code"? The practice of treating project documentation with the same rigor as code, storing it in Git and including it in the CI/CD pipeline.
11. Why is OpenTelemetry useful in CI? It allows you to visualize the entire request flow of a failing test, making it easy to see exactly which microservice or database call caused the issue.
12. What is an "Error Budget"? A defined amount of allowable unreliability (e.g., 0.1% of requests) that a service can have before new feature deployments are halted to fix stability.
13. Does parallel testing increase cloud costs? While it uses more resources in a burst, the total "Compute Minutes" are often similar, and the increase in developer velocity and reduction in "Merge Hell" usually provides a massive ROI.
14. What is "ArgoCD"? A declarative, GitOps continuous delivery tool for Kubernetes that automates the deployment and synchronization of application states.
15. How do you secure the CI/CD pipeline itself? By using "Least Privilege" secret management, signed commits, and automated "Pipeline Integrity" scans that ensure the build process hasn't been tampered with.